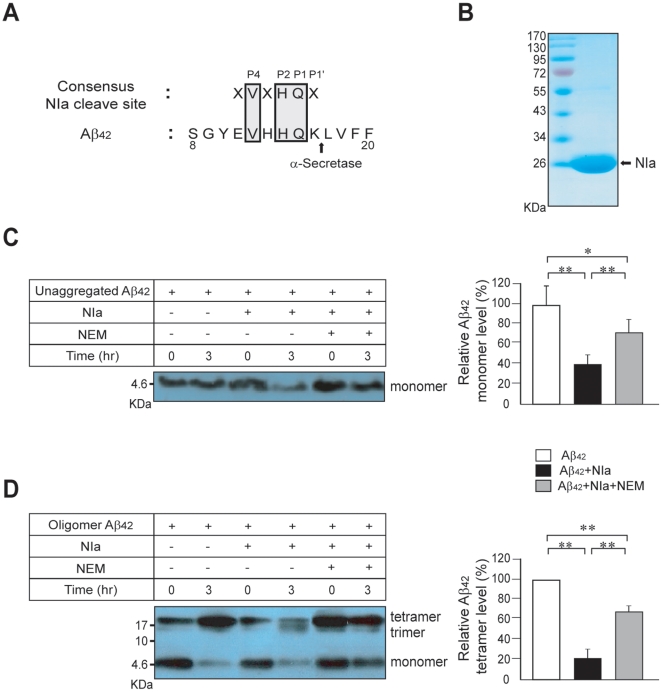
Figure 1. Cleavage of Aβ by NIa.
(A) The amino acid sequence of Aβ is aligned with the consensus cleavage site of NIa, Val-Xaa-His-Gln. (B) NIa was purified from E. coli and separated by SDS-PAGE. Lane 1, molecular size markers; lane 2, NIa (10 µg). (C) Monomeric Aβ (2.5 µM) was incubated with NIa (1.5 µM) in the presence or absence of NEM(cysteine protease inhibitor) for 3 hrs at 25°C. The reaction mixture was separated on a Tris-tricine gel, blotted, and probed with the anti-Aβ antibody, 6E10. The density of each Aβ band was quantified by densitometry. The band intensities after 3 hr incubation (lanes 2, 4, and 6) were plotted relative to the band intensities of each sample at 0 hr (lanes 1, 3, and 5). n = 4. (D) Oligomeric Aβ (2.5 µM) was incubated with NIa (1.5 µM) in the presence or absence of NEM for 3 hrs at 25°C. The reaction mixture was separated and immunoblotted with anti-Aβ antibody, 6E10. The density of oligomeric Aβ bands was quantified by densitometry. The band intensities of oligomeric Aβ after 3 hr incubation (lanes 2, 4, and 6) were plotted relative to the band intensity of the Aβ only sample at the 3 hr incubation time point (lane 2). n = 4. Error bars represent SD. *p<0.05 and **p<0.01.

