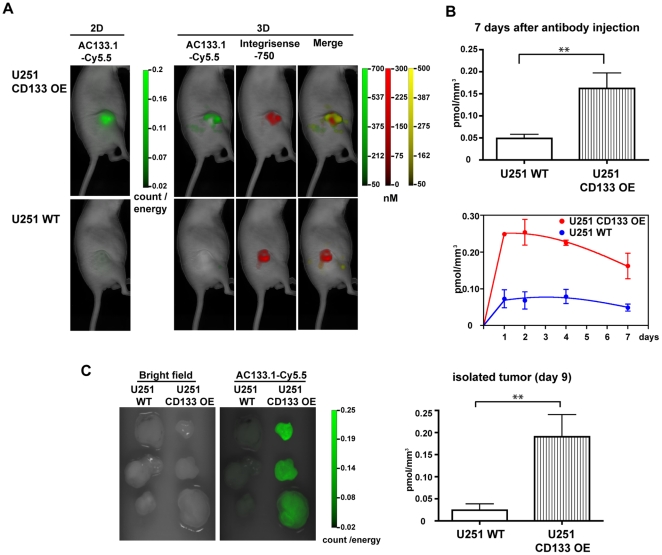
Figure 2. In vivo imaging of U251 xenografts in mice injected with Cy5.5-labeled AC133.1 antibody.
(A) U251 s.c. xenograft mice [U251 wild-type cells (lower panel) and CD133-overexpressing U251 cells (upper panel)] were injected with 75 µg AC133.1-Cy5.5 and 2 nmol of IntegriSense 750. One, 2, 4 and 7 days later, the mice were imaged using the VisEn FMT-1500 Fluorescence Molecular Tomography system. The pictures presented correspond to the last measurement at day 7. (B) Quantification of AC133.1-Cy5.5 accumulation in U251 wild-type and CD133-overexpressing U251 xenografts. Signal intensity (pmol/mm3) of the xenografts 7 days after AC133.1-Cy5.5 antibody injection (upper panel), and the resulting time course over 7 days (lower panel). (C) Signal intensity of isolated tumors 9 days after AC133.1-Cy5.5 injection. Tumors were resected from mice and imaged with an FMT-1500. WT, wild-type; OE, overexpressing.

