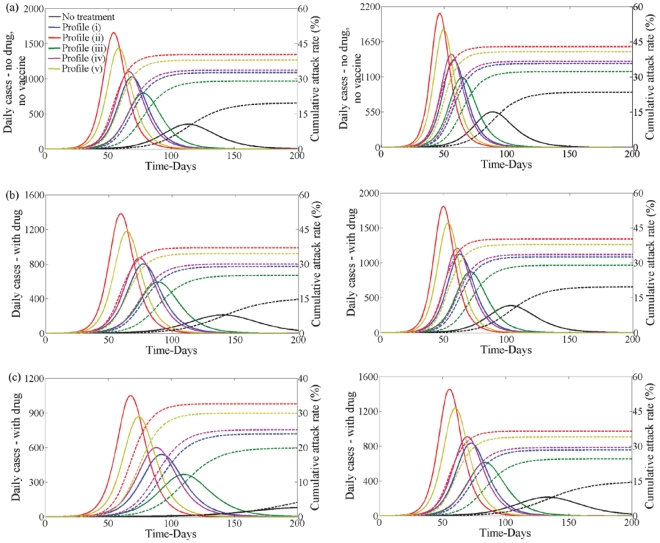
Figure 5. Disease incidence in second wave without vaccine and no school closure in first wave.
Clinical infection in second wave with no vaccine when  (left) and
  (right) having no school closure in the first wave. Lines correspond to no treatment (black) or treatment following profile (i–v) (blue, red, green, pink, yellow) in the first wave when
  . In each plot disease incidence and cumulative attack rates are shown. (a) No drug or vaccine. (b) With drug but no vaccine. Drug uptake is
  . (c) With drug but no vaccine. Drug uptake is
  .
.

