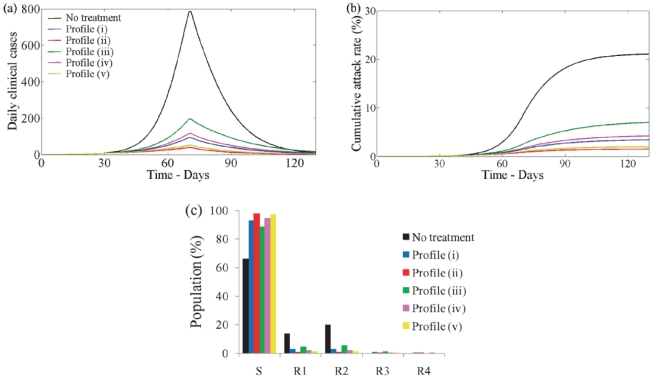
Figure 10. Disease incidence in first wave with and without treatment and school closure for last 60 days.
First wave with and without treatment considering school closure in the first wave from the day 71 to day 130. (a) Disease incidence with no treatment (black line) and with treatment profiles (i–v) (blue, red, green, pink, yellow) when  . (b) Cumulative attack rate under no treatment and treatment with profiles (i–v) when
  . For each profile of treatment the cumulative value at the end point corresponds to the clinical attack rate. (c) Distribution of resulting susceptible and recovered classes from first wave for no treatment and treatment profiles (i–v).

