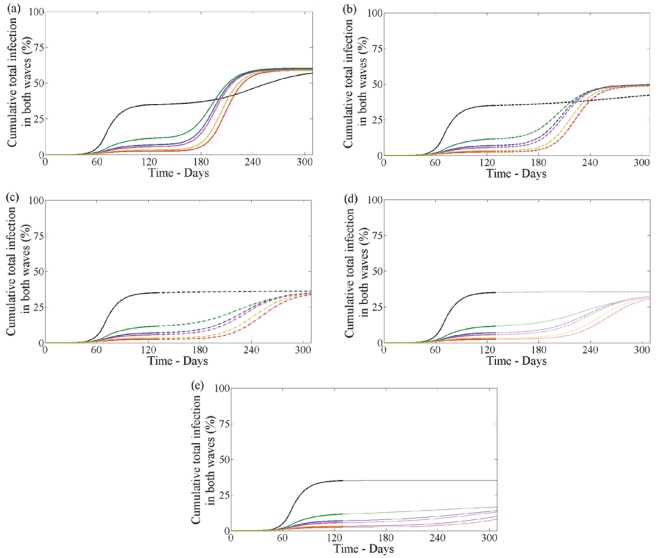
Figure 13. Cumulative total infections in both waves with school closure in first wave.
Cumulative infections (clinical and subclinical) in both waves when  in the first wave with school closure. The five panels correspond to second wave: (a) no drug or vaccine (solid line), (b) no vaccine with drug
  (dashed line), (c) no vaccine with drug
  (dashdot line), (d) with drug uptake
  and vaccine coverage
  (dotted line), (e) with drug uptake
  and vaccine coverage
  (solid line with circles). In each panel lines correspond to no treatment (black) and treatment profile (i–v) (blue, red, green, pink, yellow) in the first wave.

