Fig. 2.
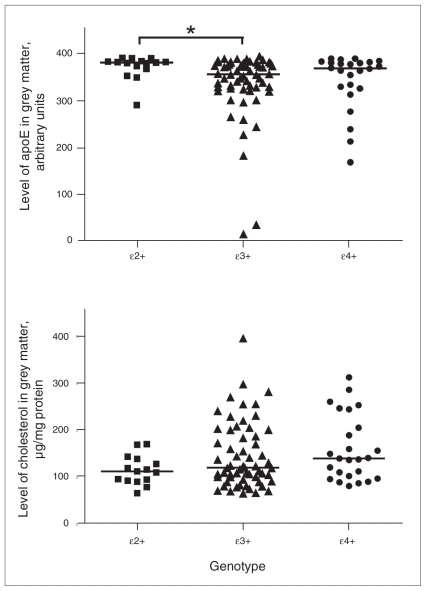
Levels of apoE and cholesterol in grey matter: effect of APOE allele. The ɛ2+ group comprised ɛ2/ɛ2 and ɛ2/ɛ3 genotypes; ɛ3+ group comprised ɛ3/ɛ3 genotype; e4+ group comprised ɛ4/ɛ4 and ɛ4/ɛ4 genotypes; ɛ2/ɛ4 genotype was excluded. (A) ApoE levels (arbitrary units) stratified by APOE allele status (ɛ2+, n = 15; ɛ3+, n = 60; ɛ4+, n = 24) in grey matter in the total sample series. Bars represent median values. Results of the Kruskal–Wallis H test indicate that apoE levels differ among genotypes (χ22 = 7.880, p = 0.019), with higher levels in the ɛ2+ group compared with ɛ3+ or ɛ4+ groups (ɛ2+ v. ɛ3+ Z = −2.815, p = 0.005, as indicated by the asterisk; ɛ2+ v. ɛ4+ Z = −1.848, p = 0.07). Note: As the enzyme-linked immunosorbent assay data values (amount of protein required to give an optical density reading of 0.4) are inversely related to the amount of target antigen present in a sample, for graphing purposes we employed a simple algebraic transformation (raw value x [−1] + constant) to plot the data in the intuitively simpler fashion where greater values represent greater amounts of the target antigen, as previously described.34 (B) Cholesterol levels (μg/mg of protein) stratified by APOE allele status (ɛ2+, n = 15; ɛ3+, n = 60; ɛ4+, n = 25) in grey matter in the total sample. Bars represent median values. Results of Kruskal–Wallis H tests indicate that cholesterol does not differ significantly between genotypes.

