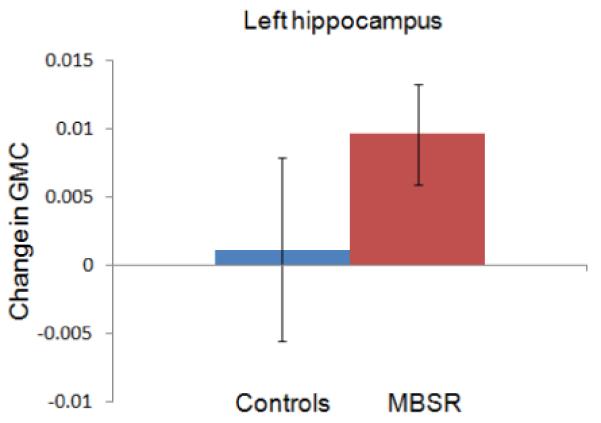
Figure 1.


Region of interest analysis identifies gray matter concentration increases in the left hippocampus (MNI coordinates x = −36 (1A), y = −34 (1B), z = −8 (1C)) in the MBSR group. Voxels (thresholded at P = 0.01 and masked for the regions of interest) are overlaid over the group-averaged brain. 1D: Change in gray matter concentration (GMC) within the cluster in the left hippocampus from the Pre to the Post time-point in the MBSR and the control group; error bars show 95% confidence interval.
