
Figure 2.
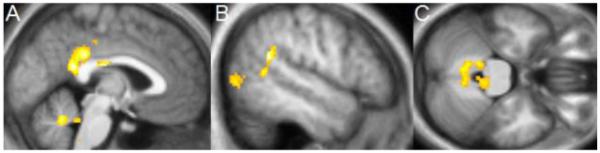
Increase in gray matter concentration in the MBSR group from Pre- to Post-intervention in the exploratory whole brain analysis. A: cluster in the posterior cingulate cortex and cerebellum (sagittal slice at x = −2); B: cluster in the left temporo-parietal junction (peak in the middle temporal gyrus; sagittal slice at x = −52); C: clusters in the cerebellum and brainstem (axial slice at z = −28). Significant clusters within the whole brain (clusters with P < .05, corrected for multiple comparisons across the entire brain, initial voxel-level threshold of P = 0.01) are overlaid over the group averaged normalized structural MPRAGE image.