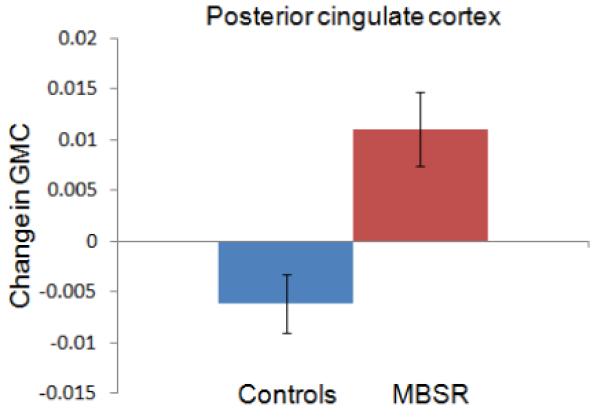
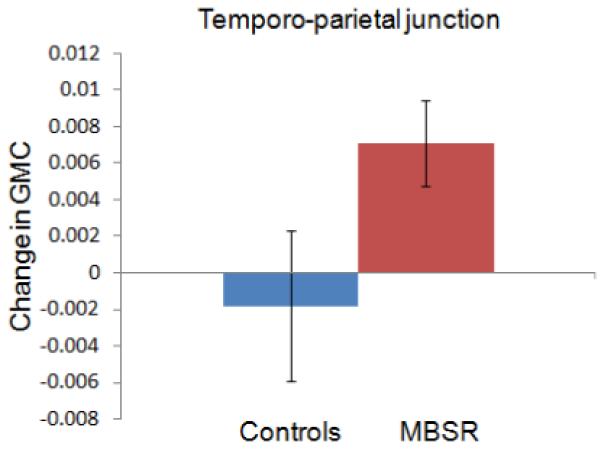
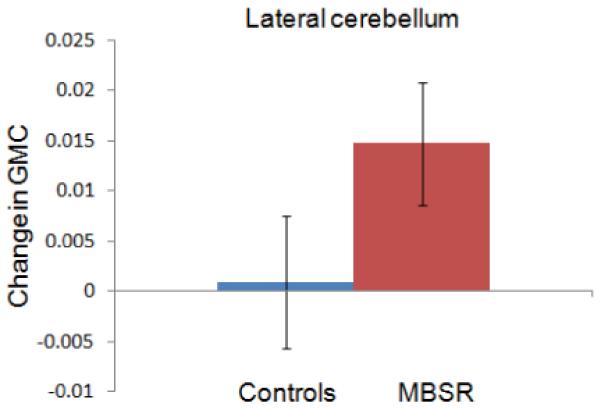
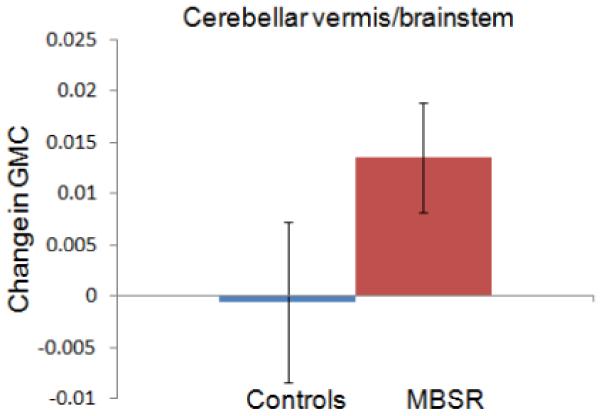
Figure 3.


Change in gray matter concentration (GMC) within the clusters in the posterior cingulate cortex (3A), the temporo-parietal junction (3B), the lateral cerebellum (3C) and the cerebellar vermis/brainstem (3D) in the MBSR and control group. Error bars show 95% confidence interval.
