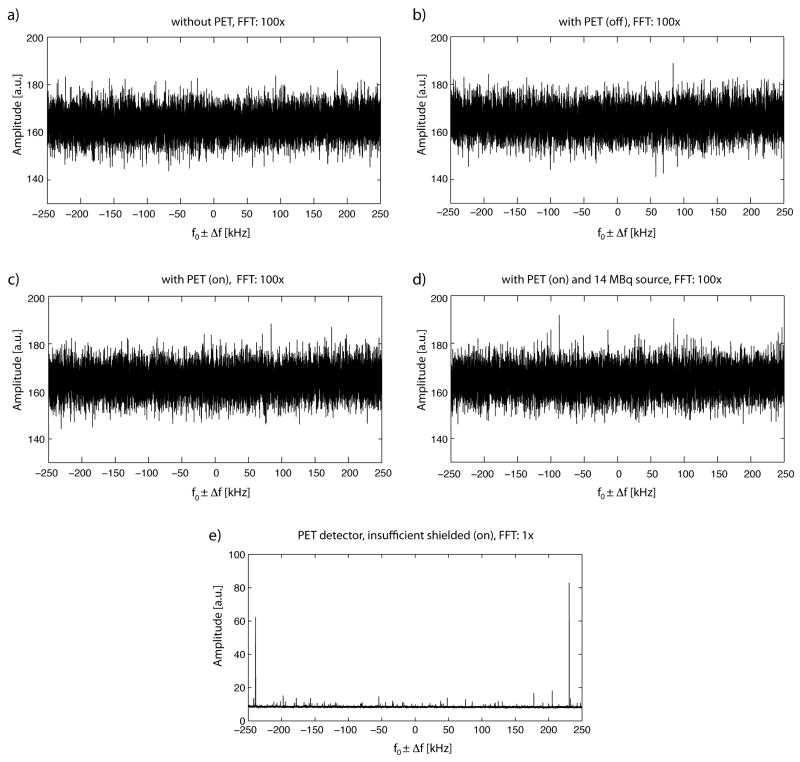
FIG. 3.
RF noise spectra of the MR system, measured in different configurations. The spectra are displayed at a resonance frequency of f0 = 300.4 MHz ± 250 kHz a) without the PET insert, b) with the PET insert installed, but powered off, c) with the PET insert powered on. d) with the PET insert installed, powered on, and collecting data from a phantom filled with 14 MBq radioactivity. No dominant noise peaks can be observed, even when the PET insert is installed and powered on. e) For control purposes an insufficiently shielded PET detector was used, leading to clearly dominant noise peaks. Note that the FFT scale factor was reduced from 100 to 1 in e).

