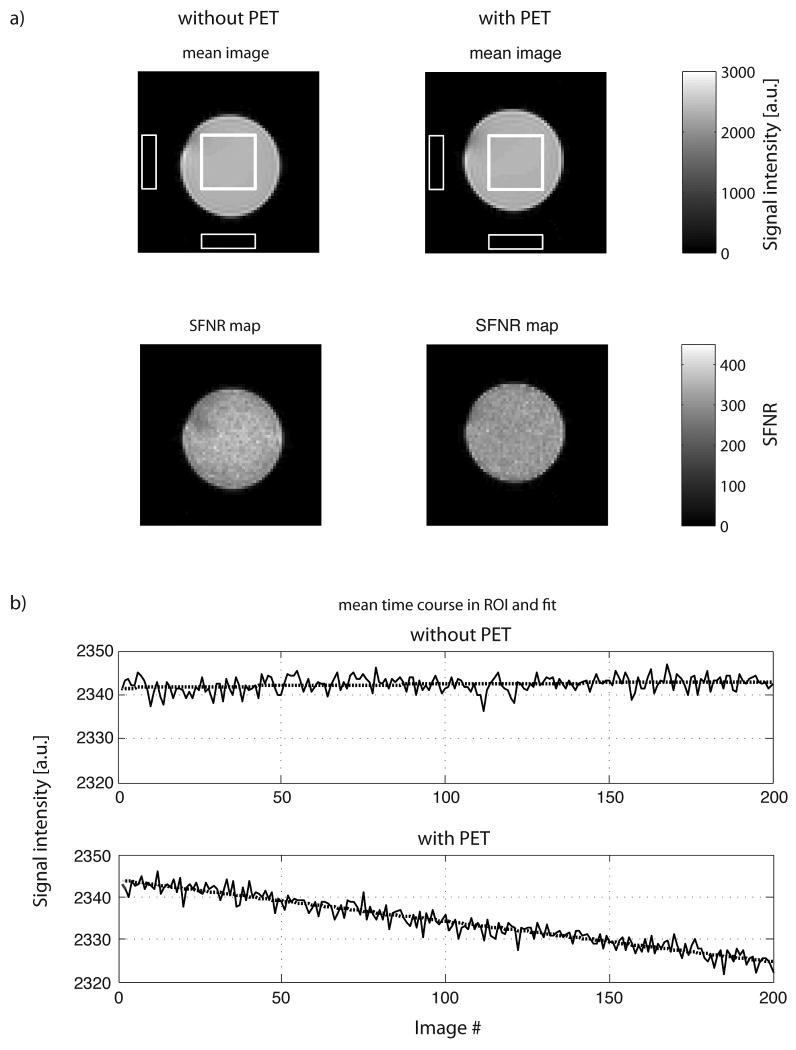
FIG. 4.
a) The mean images (top row) and SFNR maps (bottom row) for the configuration without and with the PET insert (equally scaled for both system configurations) show no differences in EPI image quality. The white squares in the center of the phantom and background are used for the calculation of the fBIRN measures reported in Table 3. b) Time series of the average signal intensity in the central ROI and 2nd order trend (dotted line) for two typical EPI experiments without (top) and with the PET insert installed (bottom). The drift in these measurements was 0.06% and 0.823% over a time range of 6 min and 44 s, respectively, without and with the PET insert in place.

