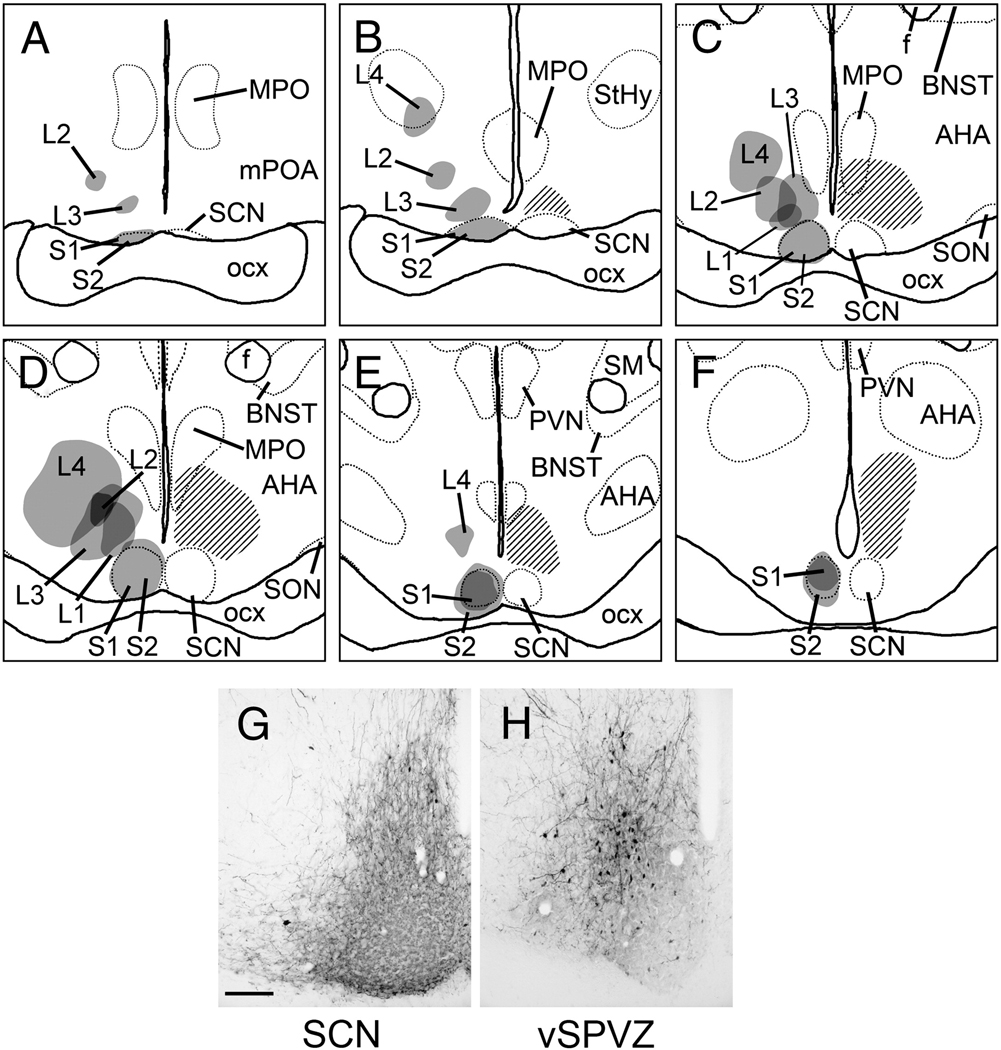
Figure 1.
A–F, Line drawings depicting the location of BDA injections in all cases described in the present study. Panels are arranged rostral-to-caudal, and were traced from sections as described in text. Gray shaded areas indicate center of tracer deposit; darker shading represents overlap between multiple cases. Cross-hatched area in each panel indicates the distribution of Fos-immunoreactive cells in the late night as determined by previous studies (adapted from Schwartz et al, 2004), and is included as a reference to indicate the vSPVZ region of interest that was targeted for injections. Dotted lines represent boundaries of selected brain structures as visualized by neutral red counterstain. G–H, representative photomicrographs of BDA injections centered in the SCN (G; case S1) and vSPVZ (H, case L3). Scale bar = 100 µm. AHA, anterior hypothalamic area; BNST, bed nucleus of the stria terminalis; f, fornix; MPO, medial preoptic nucleus; mPOA, medial preoptic area; optic chiasm, optic chiasm; PVN, hypothalamic paraventricular nucleus; SCN, suprachiasmatic nucleus; SM, stria medullaris; SON, supraoptic nucleus; StHy, striohypothalamic nucleus.

