
Figure 2.
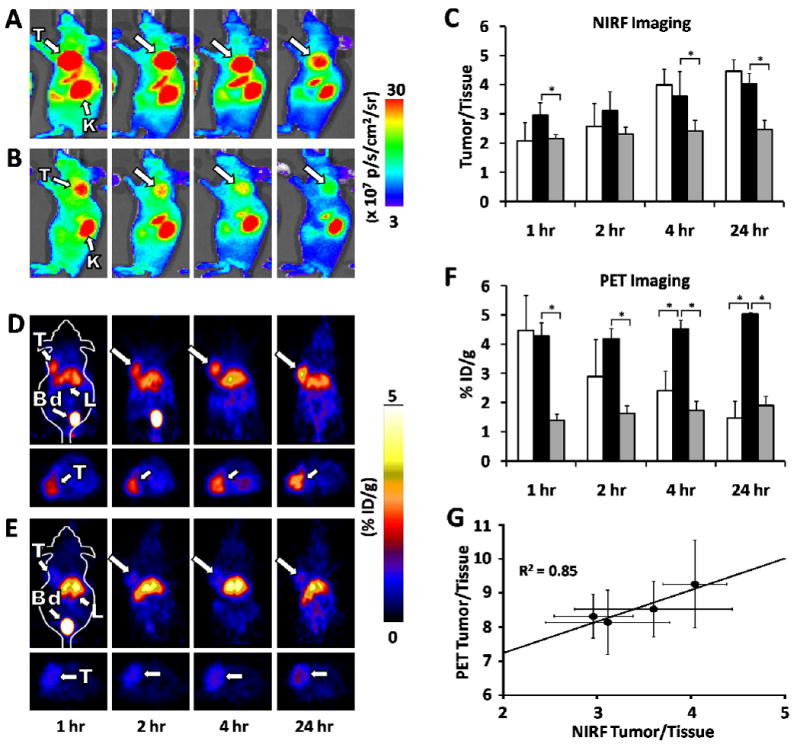
NIRF and microPET imaging of knottin probes in murine human tumor xenograft models. Mice bearing U87MG tumors were injected via tail vein with either (A) 1.5 nmol of DOTA/Cy5.5-2.5D, or (D) ∼ 100 μCi of 64Cu-DOTA/Cy5.5-2.5D. For blocking experiments (B, E), mice were co-injected with an excess (0.5 μmol) of unlabeled c(RGDyK) in addition to labeled knottin peptides. Representative images are shown at 1, 2, 4, and 24 hr post injection. T= tumor; K= kidney; Bd= bladder; L= liver. (C) NIRF imaging, represented as the tumor-to-background tissue (Tumor/Tissue) ratio for Cy5.5-2.5D (white bars), DOTA/Cy5.5-2.5D (black bars), and DOTA/Cy5.5-2.5D plus excess unlabeled c(RGDyK) blocking peptide (grey bars). (F) MicroPET imaging, quantified as the % ID/g of 64Cu-DOTA-2.5D (white bars) 64Cu-DOTA/Cy5.5-2.5D (black bars), and 64Cu-DOTA/Cy5.5-2.5D plus an excess of unlabeled c(RGDyK) blocking peptide (grey bars). Error bars represent the SD of measurements performed on at least three mice. (G) Correlation analysis of average tumor to background tissue ratios for NIRF and microPET images acquired at 1, 2, 4, and 24 hr post injection. Error bars represent the SD of measurements in three mice. (* p < 0.05).