
Figure 4.
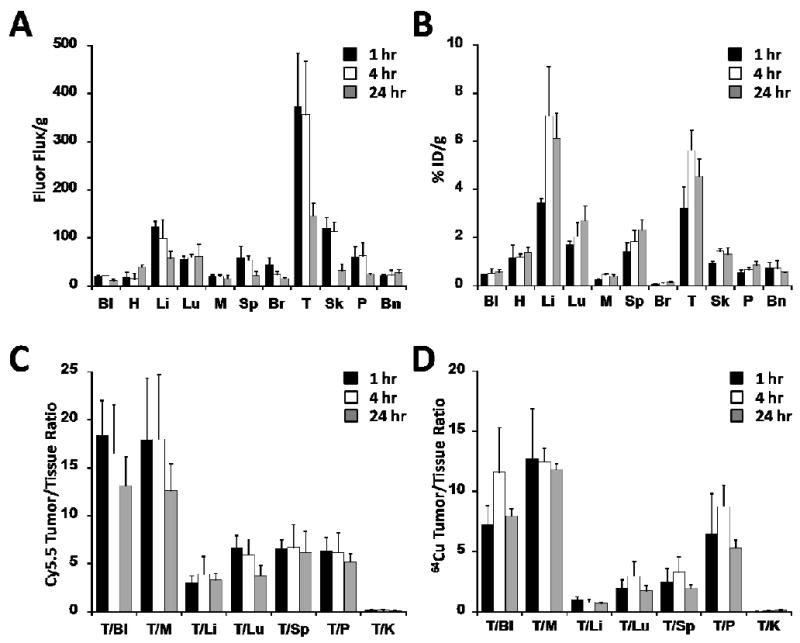
Comparison of Cy5.5 and 64Cu tissue biodistribution. The amount of (A) DOTA/Cy5.5-2.5D or (B) 64Cu-DOTA/Cy5.5-2.5D accumulation was measured in the blood (Bl), heart (H), liver (Li), lung (Lu), muscle (M), spleen (Sp), brain (Br), tumor (T), skin (Sk), pancreas (P), and bone (Bn). (A) Cy5.5 uptake, measured as the fluorescence flux (photons per second) per gram of tissue. (B) 64Cu uptake, quantified as the %ID/g. Comparison of Tumor/Tissue ratios observed at 1, 4, and 24 hr post injection for (C) DOTA/Cy5.5-2.5D or (D) 64Cu-DOTA/Cy5.5-2.5D.