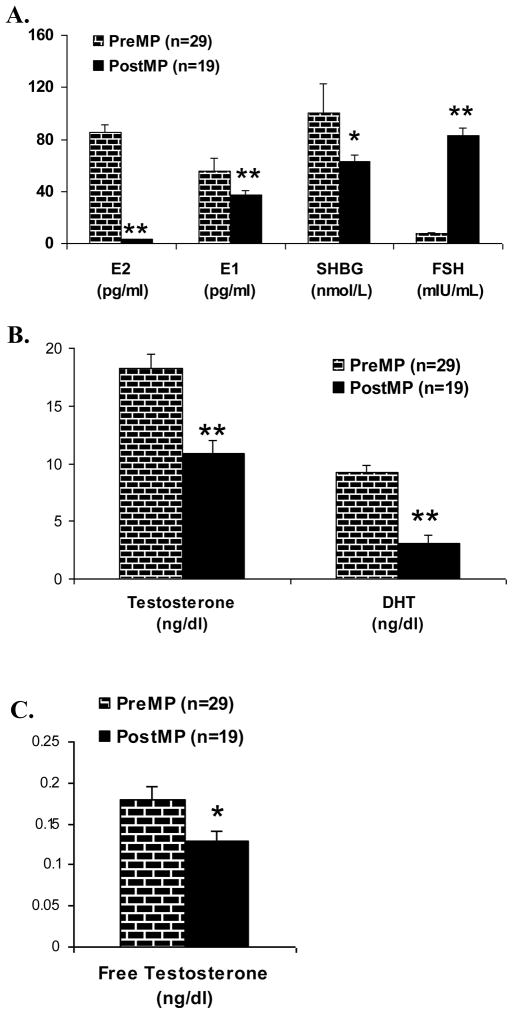
Figure 2.
Panel A
E2, E1, SHBG and FSH levels during EFP in premenopausal women compared to postmenopausal women. E2 and E1 were measured by LCMS/MS (**p<0.0001). SHBG and FSH levels were measured by fluroimmunometric assay (*p<0.05 and **p<0.0001).
Panel B
T and DHT levels during EFP in premenopausal women compared to postmenopausal women. T and DHT were measured by LCMS/MS (**p<0.001).
Panel C
Free T during EFP in premenopausal women compared to postmenopausal women. Free T was calculated as described in methods. (*p<0.05).

