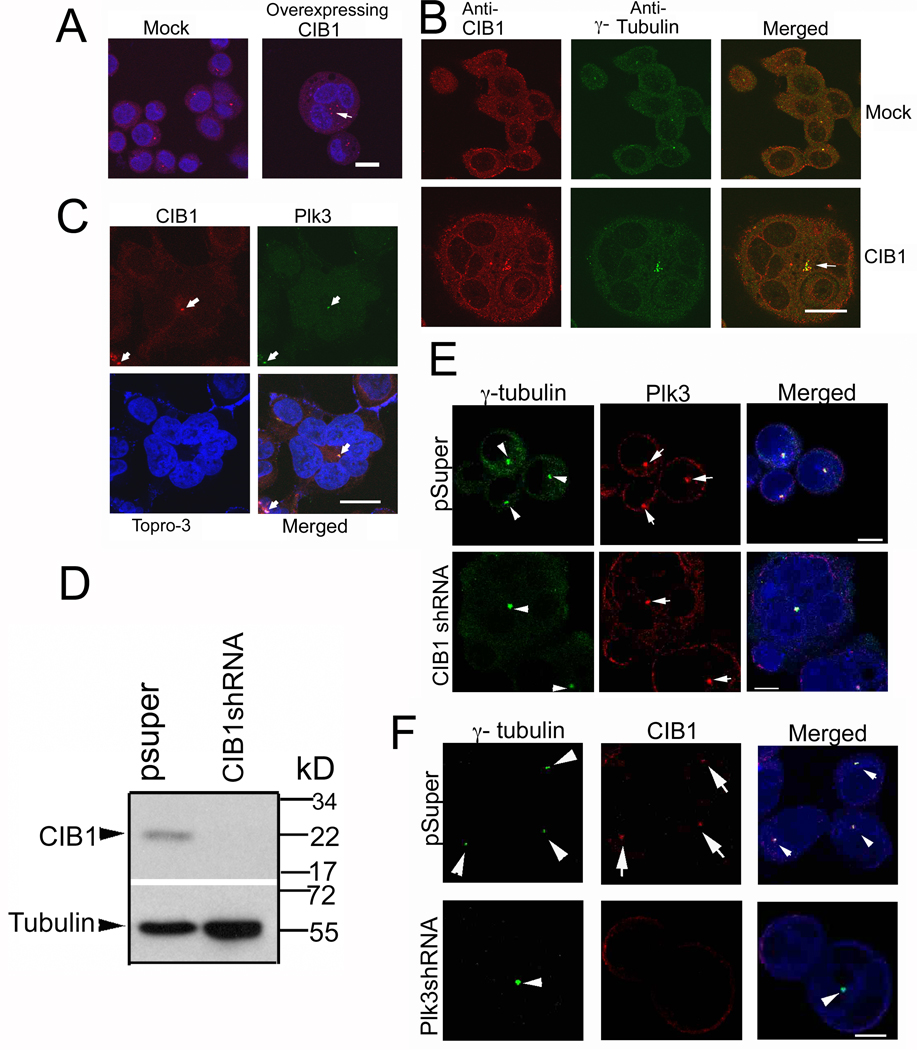
Fig. 6.
CIB1 and Plk3 colocalize at MTOC. (A) Confocal images of Mock- and CIB1-overexpressing cells immunostained for DNA (blue) and γ-tubulin (red). Arrow indicates multiple centrosomes. (B) Cells from A were immunostained for CIB1 (red) and γ-tubulin (green), arrow indicates centrosomes. (C) Cells from A were immunostained for CIB1 (red), Plk3 (green), and DNA (blue). Arrows indicate putative position of centrosomes. Images shown are representative of about 20% of the total cell population. (D) Immunoblots of T47D cells stably transfected with pSuper or CIB1 shRNA, blotted using anti-CIB1 and reprobed using anti-tubulin as a loading control. (E) Confocal images of cells from D immunostained for DNA (blue), Plk3 (red) and γ-tubulin (green). Arrowheads indicate centrosomes and arrows indicate Plk3. (F) Confocal images of T47D cells transfected with pSuper or Plk3 shRNA immunostained for DNA (blue), γ-tubulin (green) and CIB1 (red). Arrowheads indicate centrosomes and arrows indicate CIB1. Bars: A–C, 20µm; E–F, 10µm.

