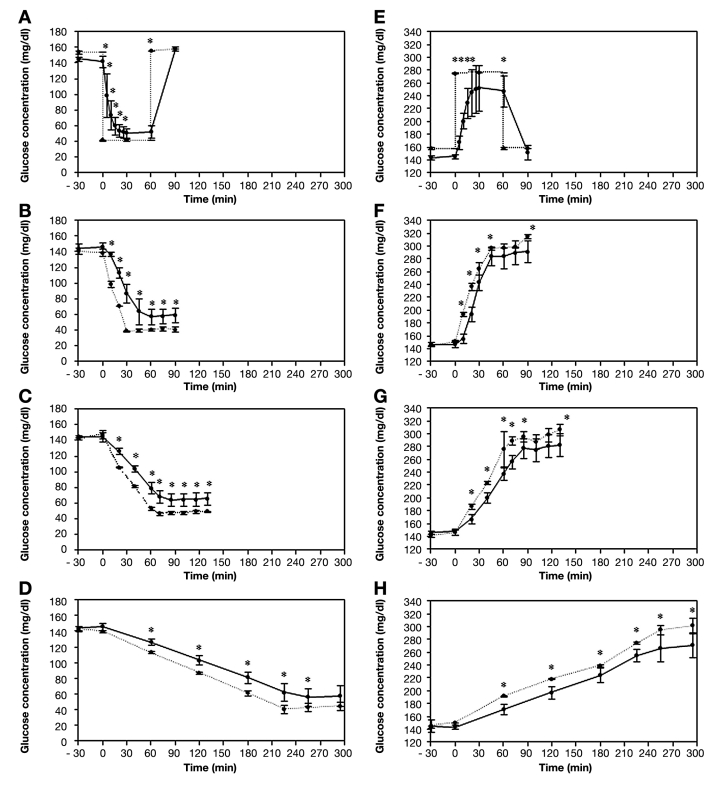
Figure 1.
CGMS readings (solid lines) and corresponding glucose buffer solution concentrations (dashed lines) in response to (A) an instantaneous, (B) rapid (220 mg/dl/hr-1), (C) moderate (90 mg/dl/hr-1), and (D) slow (30 mg/dl/hr-1) rate of fall in glucose concentration and (E) an instantaneous, (F) rapid (220 mg/dl/hr-1), (G) moderate (90 mg/dl/hr-1), and (H) slow (30 mg/dl/hr-1) rise in glucose concentration. Results are expressed as mean ± SD. *Significant difference between CGMS and glucose buffer concentrations (p ≤ .01).

