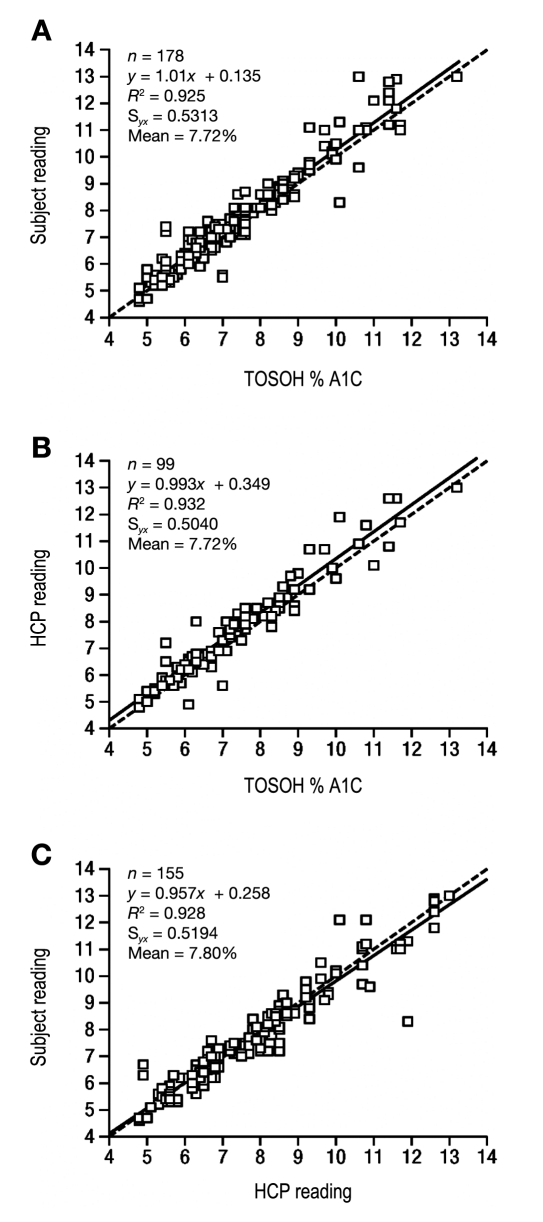
Figure 1.
Regression analysis of subject and HCP readings: subject readings compared with TOSOH method (A), HCP readings compared with TOSOH method (B), and subject readings compared with HCP readings (C). Solid lines are lines of regression from the corresponding equation in each panel, and dotted lines are lines of identity (y = x).

