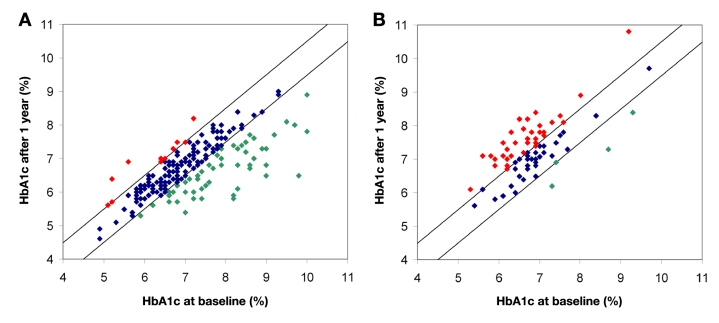
Figure 2.
Comparison of HbA1ct0 and 12 months later in patients (A) treated with PDS and (B) treated conventional without use of PDS. For each patient, HbA1ct0 (x axis) is plotted versus HbA1c after one year (y axis) treated by use or nonuse of KADIS-based PDS. The diagonal area represents HbA1ct0 ± 0.5%. Green dots are patients in whom the HbA1c decreased over 0.5%. Red dots represent patients were the HbA1c increased >0.5%.

