
Figure 2.
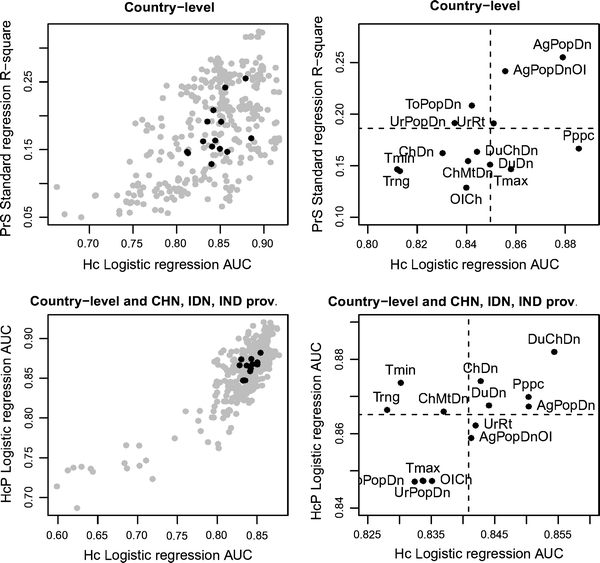
Goodness of fit indicators of HPAI H5N1 model groups for all countries (top left and right), and all countries and Chinese (CHN), Indonesian (IDN), and Indian (IND) provinces (bottom left and right). All-countries models (top left and right) are represented by the R 2 of the seasonal persistence standard regression model (PrS) as a function of the area under curve (AUC) of the human case presence logistic regression model (Hc). All-countries and province models (bottom left and right) are presented by the AUC of the human case persistence logistic regression model (HcP) as a function of the AUC of the human case presence logistic regression model (Hc). Left plots show all individual models (gray dots) and the median R 2 or AUC for each collection of models containing a variable (black dots). The right plots show only R 2 or AUC median values for collection of models containing each variable (the dotted lines are the median R 2 or AUC estimated over all models). Variable abbreviations are as follows: AgPopDn agricultural population density, AgPopDnOI agricultural population density by output/input chicken, ChDn chicken density, ChMtDn chicken meat density, DuDn duck density, DuChDn duck by chicken density, OICh output/input chicken, Pppc purchasing power per capita, ToPopDn total population density, Tmin, Tmax, Trng temperature min, max, and range, UrPopDn urban population density, UrRt urban to total population ratio.