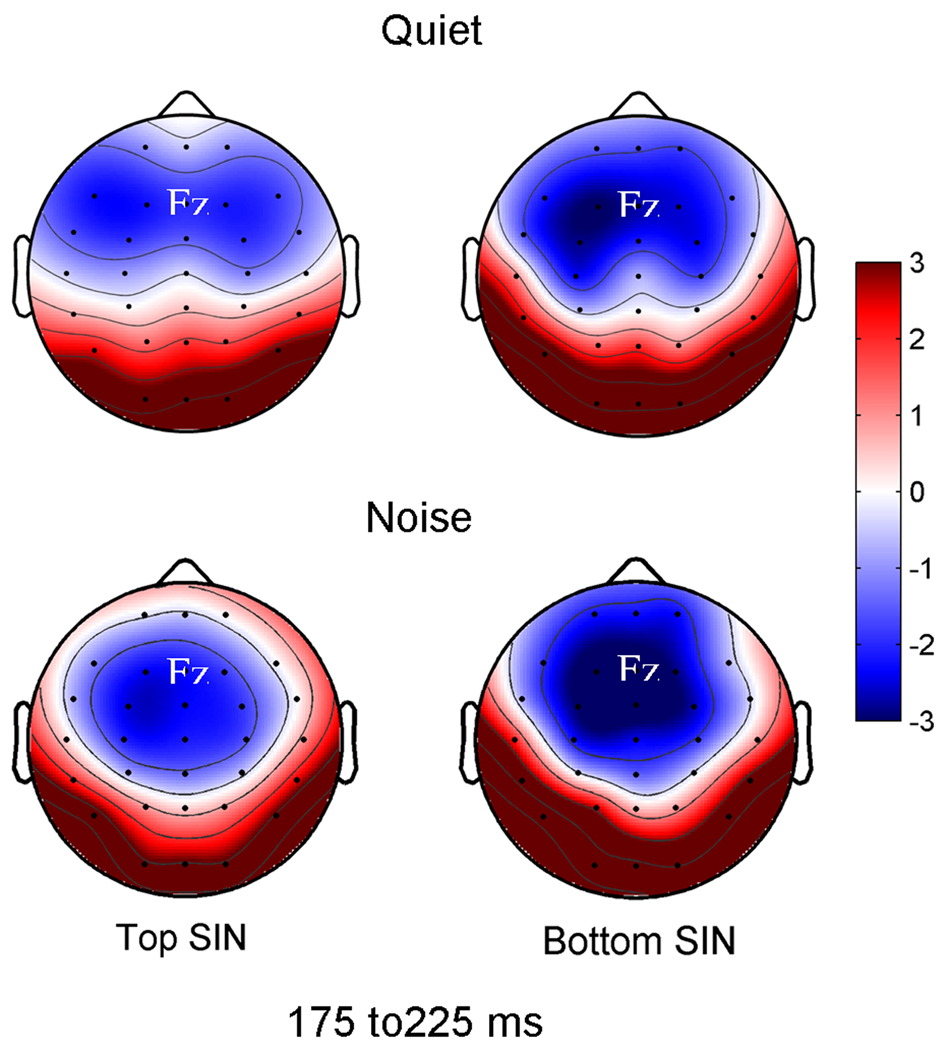
Figure 2.
Effects of noise in top vs. bottom SIN groups. Headplots demonstrate greater neural activity in the noise condition in the bottom SIN group in the 175 to 225 ms. There were significant effects of noise for the Fz channel in the bottom SIN group range (F1,14 = 4.861, p = 0.045) but not in the top SIN group (F1,14 = 0.699, p = 0.471).

