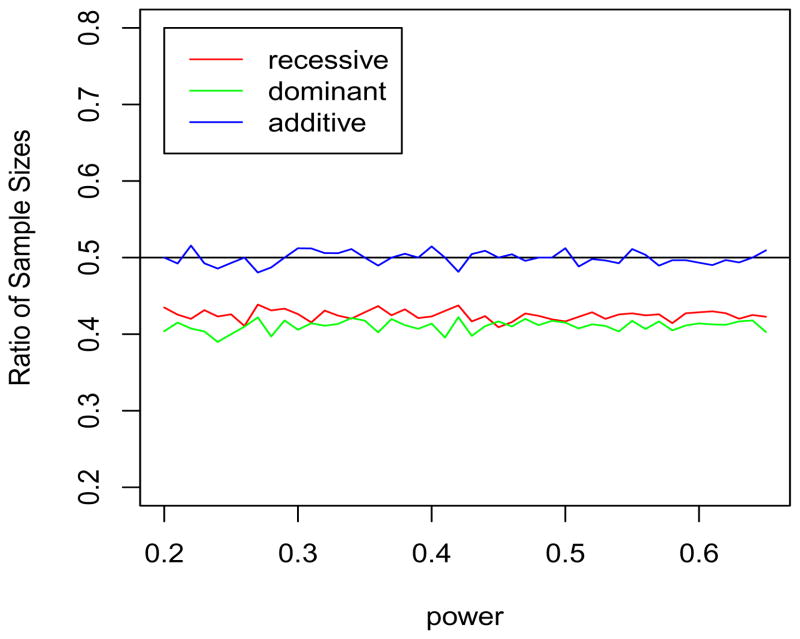
Figure 1.
Estimated ratios of samples sizes for marginal association testing, nX/nG, are shown for three genetic models. The sample sizes, nX for the causal SNP and nG for the tag SNP, are chosen such that the power to detect association at the two markers is similar. The tag and causal SNPs have an LD r2 = 0.5.

