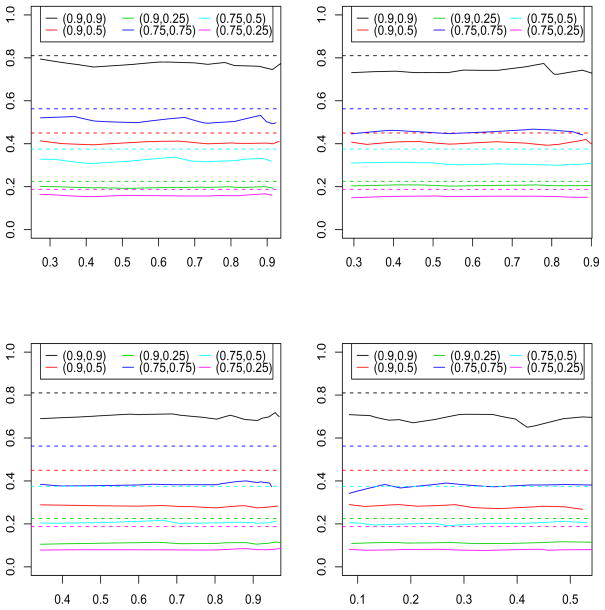
Figure 2.
The solid line is the ratio of sample sizes (y-axis) that lead to a particular power (x-axis). The dashed line is the product of the r2. The top left, top right, bottom left, and bottom right panels correspond to models A, B, C, and D respectively. All results are based on 1000 repetitions.

