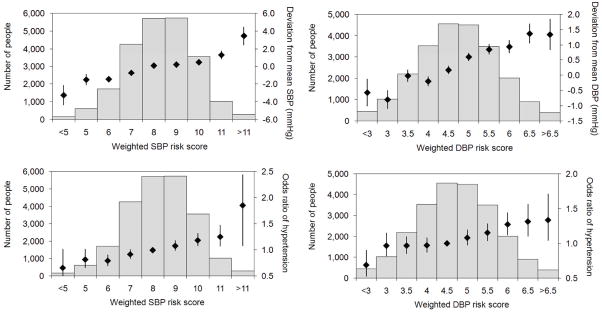
Figure 1. SBP and DBP risk scores.
Aggregate effects of risk alleles on blood pressure phenotypes are summarized in a weighted risk score for SBP and DBP, respectively. The relationship between risk score and deviation from mean SBP or DBP are shown in the top panels. Black diamonds indicate the mean BP deviation for each risk score grouping, with black whiskers indicating the standard errors. The bottom panels show black diamonds to indicate the relationship between SBP (left) and DBP (right) risk score and odds ratios of HTN, with black whiskers representing 95% CIs. The p-values for slopes across risk score groups were all highly significant (P < 0.0001 for all 4 comparisons)

