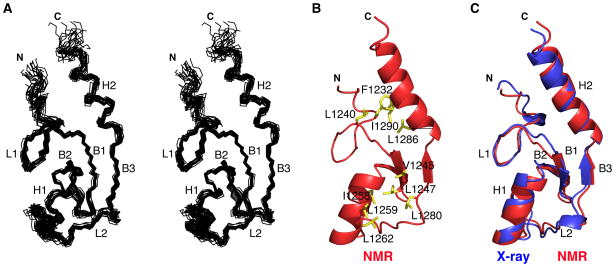
Figure 1. Solution and Crystal Structures of E4B U-box.
(A) Superposition of the 20 lowest energy NMR structures of E4B U-box in stereoview showing only the N, Cα , and C’ trace for aa 1228 to 1300. The α-helices (H), β-strands (B) and loops (L) are indicated.
(B) Ribbon representation of the NMR structure of E4B U-box showing only residues 1226 to 1302 and amino acid side chains (yellow) forming two hydrophobic cores.
(C) Overlay of the crystal (aa 1226 to 1300) and NMR (aa 1226 to 1300) structures of E4B U-box where α-helices (H), β-strands (B) and loops (L) are indicated.
See also Figure S1. Structure representations were prepared using MOLMOL (Koradi et al., 1996) or PyMOL (http://pymol.sourceforge.net/).

