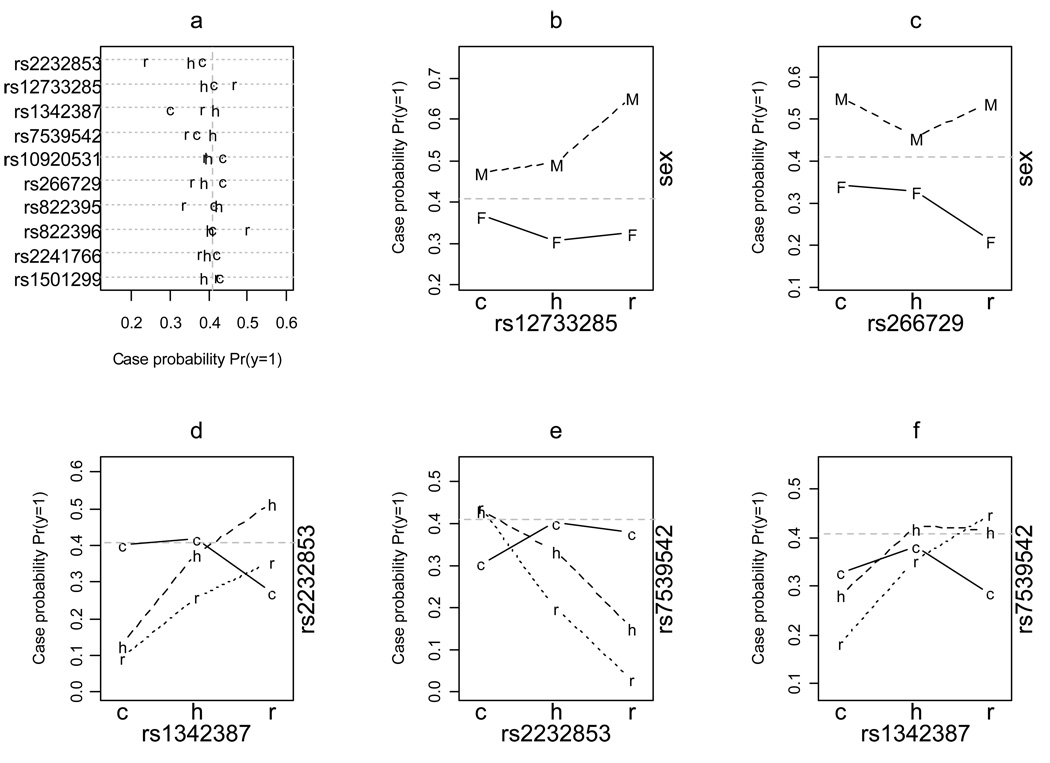
Figure 3.
Average predictive probability for a) each genotype, b–c) each combination of sex and genotypes of SNPs rs1273385 and rs266729, and d–f) each two-locus genotype at SNPs that show significant interactions. The genotypes c, h, and r represent common homozygote, heterozygote, and rare homozygote, and the notation M and F represent male and female, respectively. The vertical (a) and horizontal (b–f) dotted gray line represents the mean of probabilities.

