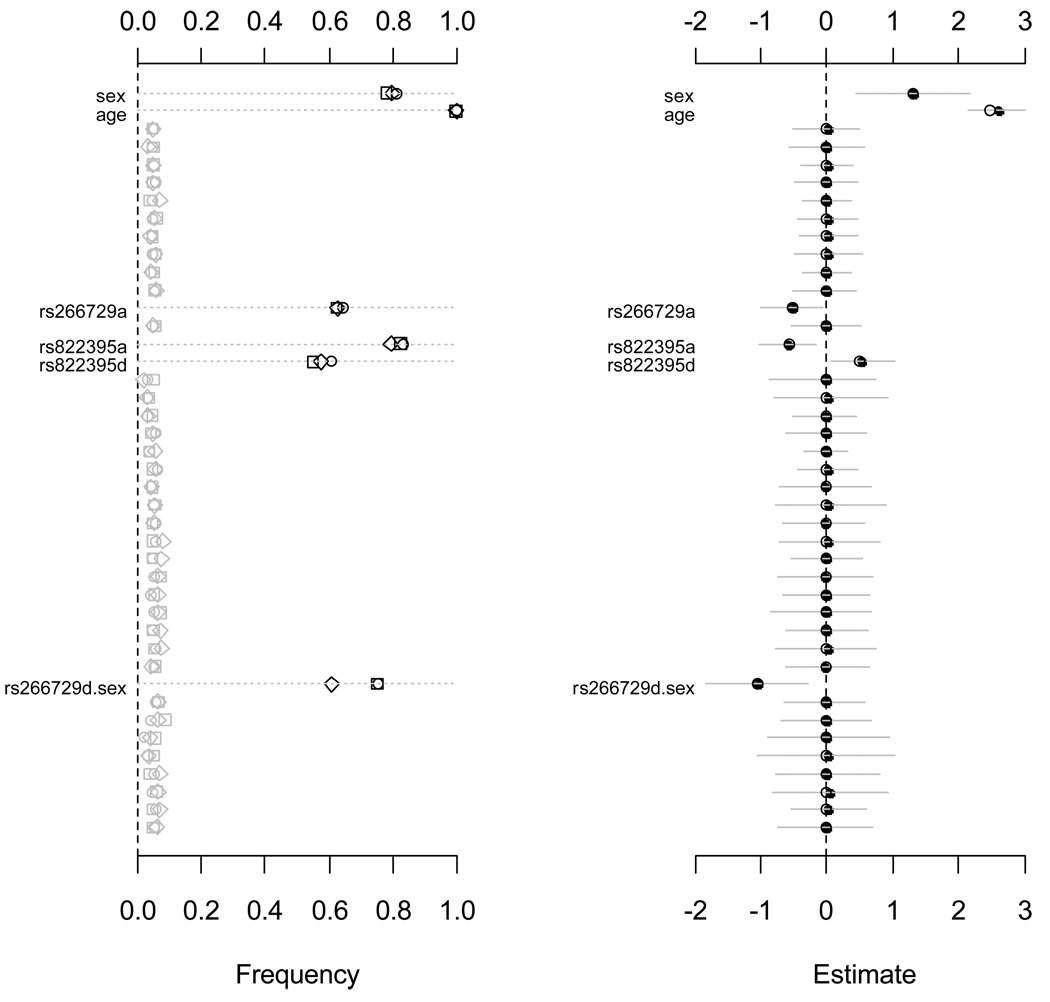
Figure 4.
Simulation I: jointly fitting age, sex, all main effects of the ten SNPs and sex-gene interactions using the proposed priors. The left panel shows the frequency of each effect estimated with p-value smaller than 0.05 over 1000 replicates with three link functions, logit (circle), probit (square) and cloglog (diamond). The right panel shows the assumed values (circle), the estimated means (point) and the 95% intervals (gray line) with the logit link function. Only effects with non-zero simulated value are labeled. The notation for main effects, a and d, indicate additive and dominance effects, respectively. The term X1.X2 represents interaction between X1 and X2.

