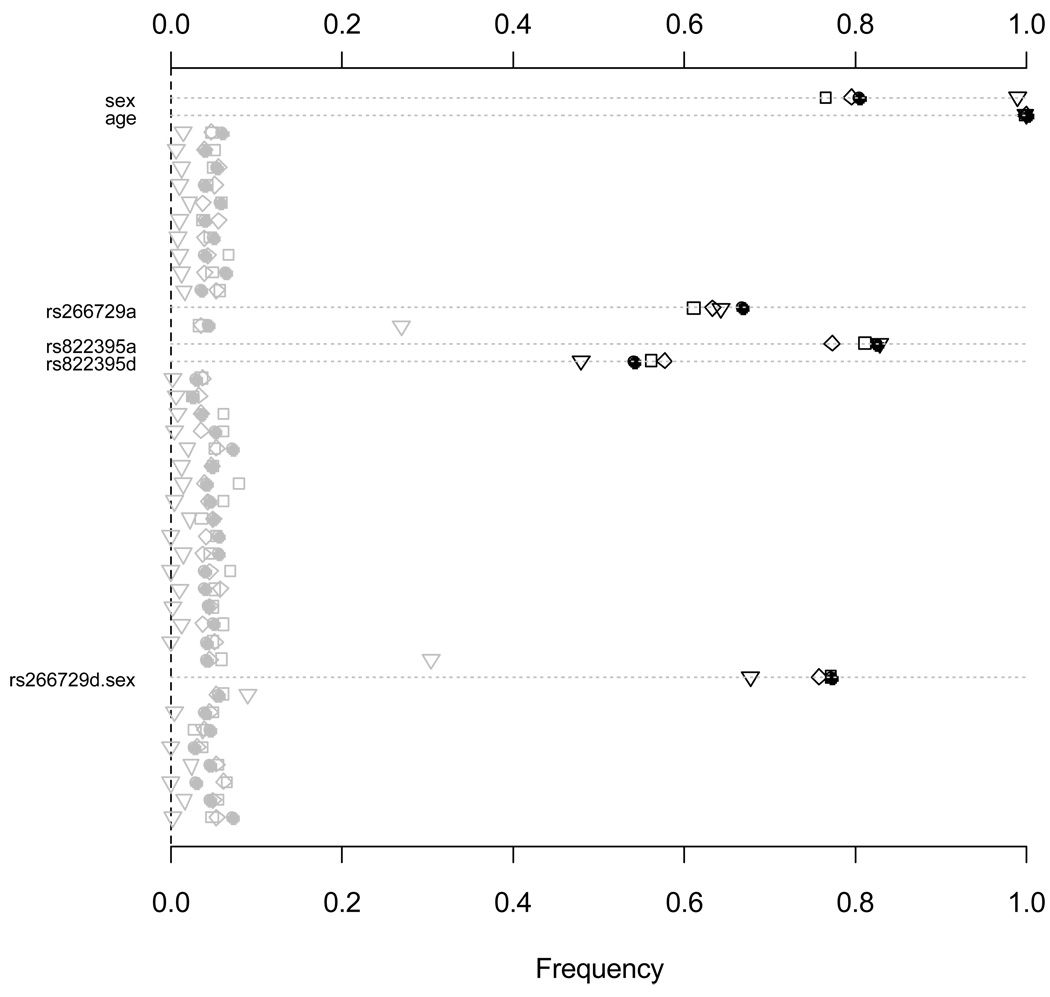
Figure 5.
Comparison with existing models (I): jointly fitting age, sex, all main effects of the ten SNPs and sex-gene interactions using different priors. Frequency of each effect estimated with p-value smaller than 0.05 over 1000 replicates using 1) uniform prior (νj, sj) = (∞, ∞) (□), 2) normal prior (νj, sj) = (∞, 2.5) (◊), and 3) Jeffreys’ prior (νj, sj) = (0, 0) (∇), for all effects. The points (•) represent the analysis using the proposed priors. Only effects with non-zero simulated value are labeled. The notation for main effects, a and d, indicate additive and dominance effects, respectively. The term X1.X2 represents interaction between X1 and X2.

