Figure 6.

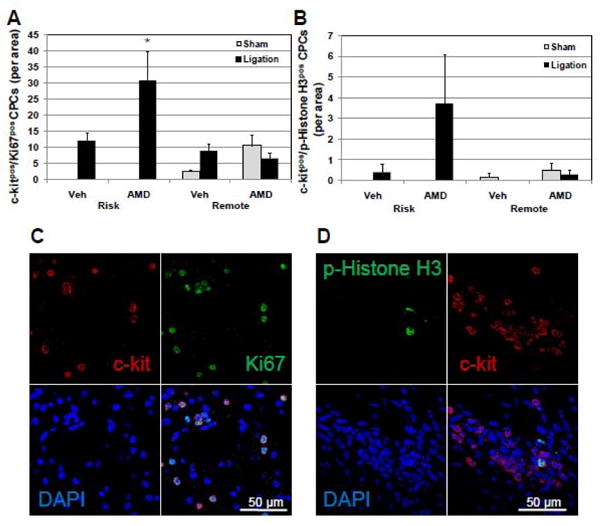
AMD3100 treatment increases proliferating c-kitpos CPCs in the risk area after ligation. To determine whether the increased number of c-kitpos CPCs in the LV of mice treated with AMD3100 after ligation was a consequence of increased proliferation, the number of c-kitpos CPCs that had entered the cell cycle 20 days after ligation was determined by immunofluorescent detection of the proliferation marker, Ki67, and the mitosis marker, phosphohistone H3. (A) c-kitpos/Ki67pos CPCs are increased in the risk area in AMD treated mice after ligation. (B) c-kitpos/phosphohistone H3pos CPCs are increased in the risk area of AMD treated mice after ligation. (C and D) Representative confocal images of proliferating c-kitpos CPCs expressing Ki67 or phosphohistone H3. Values are mean ± SEM (n=6). *P<0.05 vs Vehicle Ligation; § P<0.05 vs Vehicle Sham; †P<0.05 vs AMD Sham.
