Fig. 2.

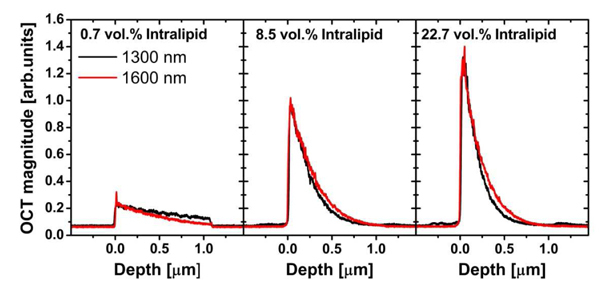
OCT signals vs. depth for 0.7%, 8.5% and 22.7 vol.% Intralipid samples for the two wavelengths (data before background subtraction and PSF correction).

OCT signals vs. depth for 0.7%, 8.5% and 22.7 vol.% Intralipid samples for the two wavelengths (data before background subtraction and PSF correction).