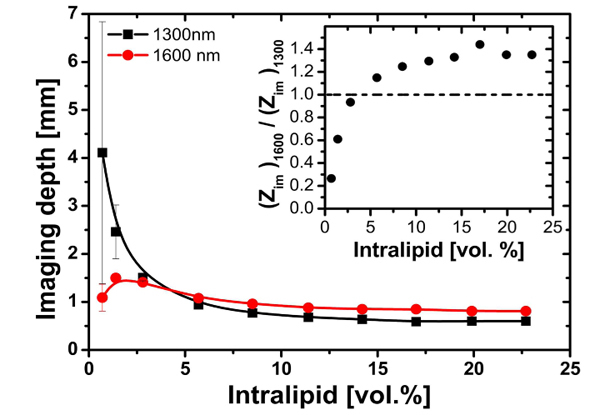
Fig. 4.

OCT imaging depth for varying Intralipid concentration measured at 1300 and 1600 nm. The solid lines are visual guides. Error bars depict standard deviations of the measurements. Inset: ratio of measured OCT imaging depths. The dashed line indicates equal imaging depth at 1300 and 1600 nm.
