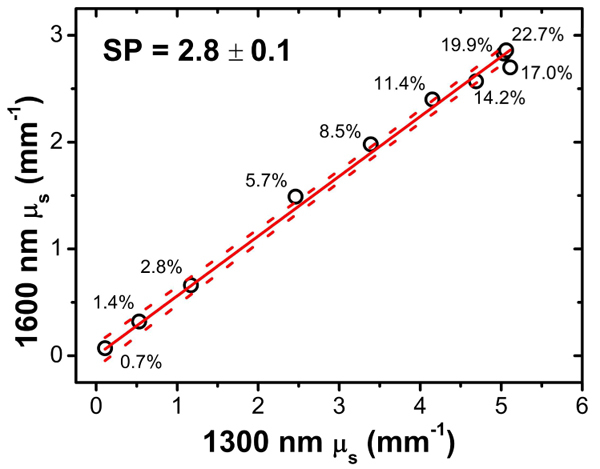
Fig. 5.

Measured µs at 1600 nm versus 1300 nm. Sample points are marked according to the Intralipid concentration. From a linear fit to the data (solid line) we determine the SP value for Intralipid (indicated). The dashed lines indicate the 95% confidence interval of the fit.
