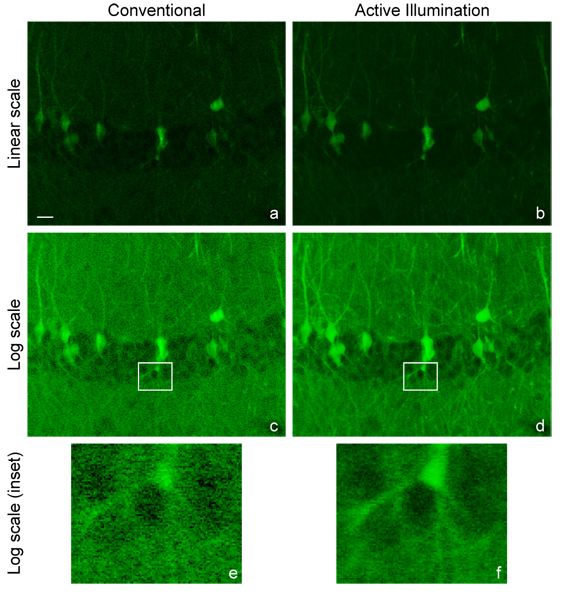
Fig. 4.

Image of mouse brain labeled with GFP (scale bar 20 μm). Conventional TPEF image, linear scale (a) and log scale (c). AIM image, linearized in software (b) and as acquired on log scale (d). Magnified insets of (c) and (d) shown respectively in (e) and (f). Video online of (a) to (d) showing a depth scan through 98 μm at a 2 μm spacing between slices.(Media 1 (2.3MB, AVI) )
