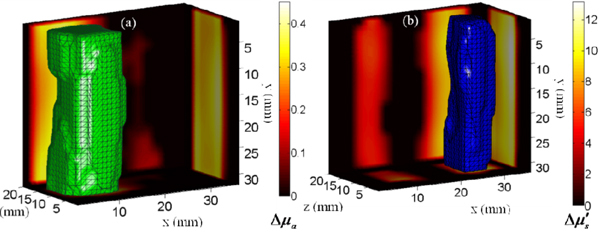
Fig. 7.

(Media 1 (3.3MB, AVI) ) (a)-(b) show the 50% isovolumes of the reconstructed differential absorption and scattering coefficients respectively. (Boundary maps) The reconstructed slices along y = 15mm, z = 11mm and x = 13mm and 29mm for (a) and (b) respectively.
