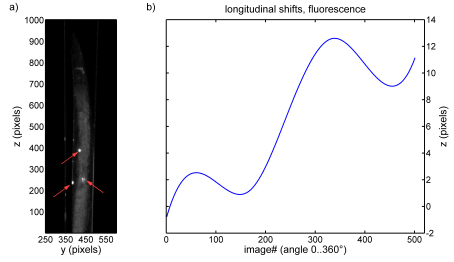
Fig. 2.
Correction of longitudinal shifts in fluorescence images. a) 2D projection (raw data) as acquired in the experiment. The three arrows indicate the positions of the GFP expression loci of three touch neurons, which appear as point-like structures in the acquired images. b) The average z-displacement of the three expression loci in the 500 projections can be used to correct for longitudinal shifts.

