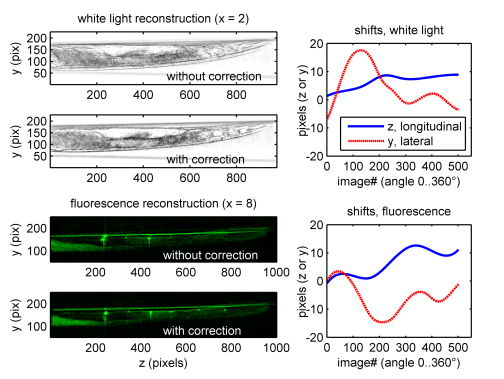
Fig. 7.
Summary of the applied corrections for white light data (top half) and fluorescence data (bottom half). Left column: Raw z-y-data-slices of the 3D reconstruction before and after applying the correction methods. Right column: Shifts used to correct the projections prior to the reconstruction. First the longitudinal shifts were corrected, and then the lateral shifts. Slices of the reconstructions after correction for longitudinal and for lateral shifts are much sharper, and do not show ghost images, indicating an improved reconstruction.

