
Fig. 2.
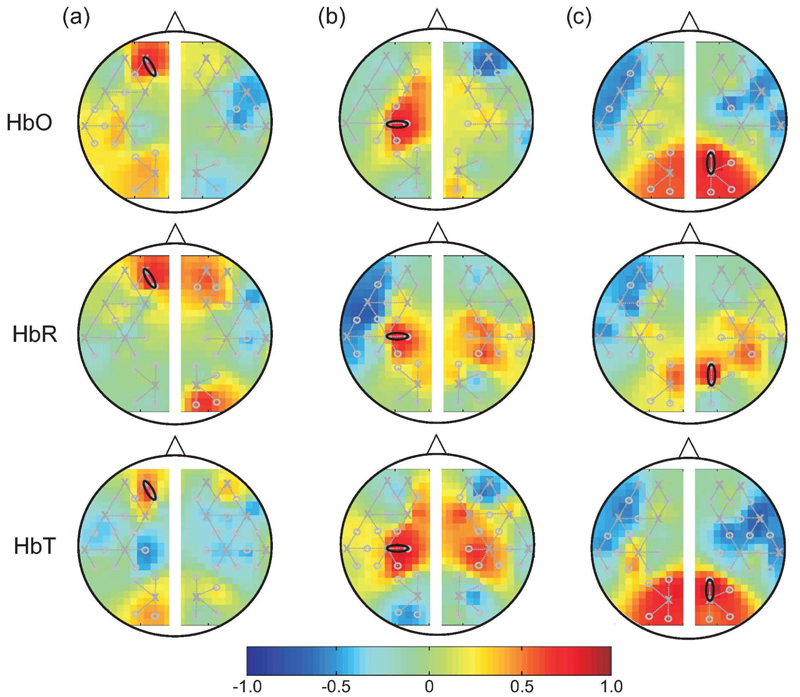
Average correlation maps during resting state in a subject for all the three hemoglobin contrasts when the seed was placed on (a) prefrontal, (b) sensorimotor, and (c) visual cortex. The position of the seed is indicated by the black circle, and the colorbar represents the correlation coefficients. Orientation of the head is indicated by the nose pointing up.