
Fig. 3.
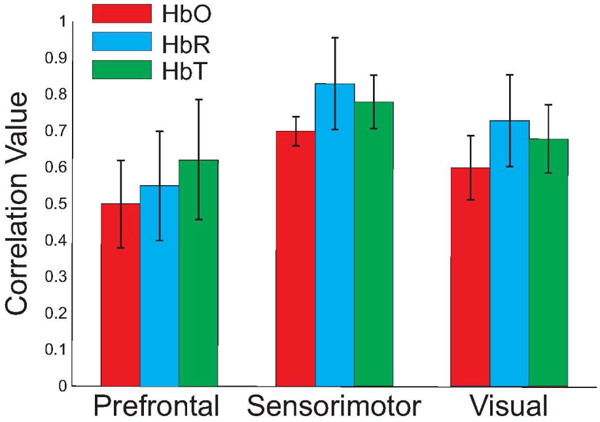
Grand average of the symmetric correlation values obtained for the three main cortical regions measured, for each hemoglobin contrast. Correlation was calculated between a given seed time course and its corresponding contralateral channel, and then averaged over all possible seeds in each region. Error bars represent the standard deviation across all subjects.