Fig. 2.

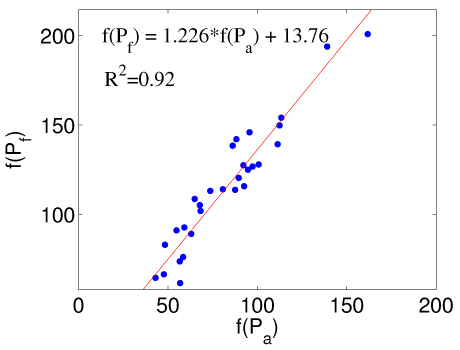
X-ray intensity values (0-255) for “pure” adipose, f(Pa), and fibroglandular tissue, f(Pf), extracted from 31 DBT healthy breast images. The red-line denotes the linear regression line with the equation labeled in the figure.

X-ray intensity values (0-255) for “pure” adipose, f(Pa), and fibroglandular tissue, f(Pf), extracted from 31 DBT healthy breast images. The red-line denotes the linear regression line with the equation labeled in the figure.