Fig. 2.

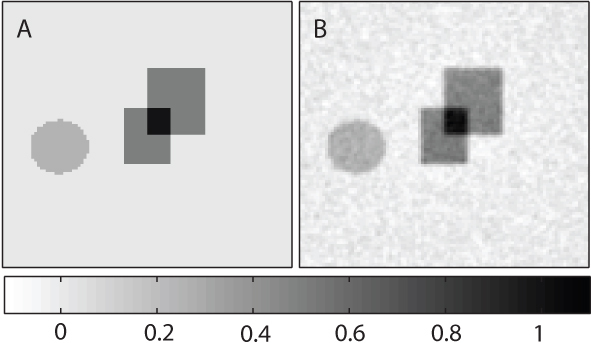
A: The true values of the concentration of the nonlinear chromophore (arranged so that they lie between 0 and 1). The image size is 15 mm × 15 mm. B: The estimate of the concentration obtained using Eq. (4).

A: The true values of the concentration of the nonlinear chromophore (arranged so that they lie between 0 and 1). The image size is 15 mm × 15 mm. B: The estimate of the concentration obtained using Eq. (4).