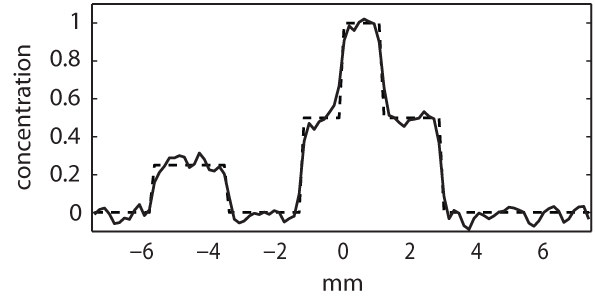
Fig. 3.

Profiles through Figs. 2A and 2B showing the true concentration (dashed line) and its estimate using Eq. (4) (solid line), showing that the concentration of a chromophore whose absorption switches off at some known fluence threshold may be estimated from multiple photoacoustic images obtained at increasing illumination strengths.
