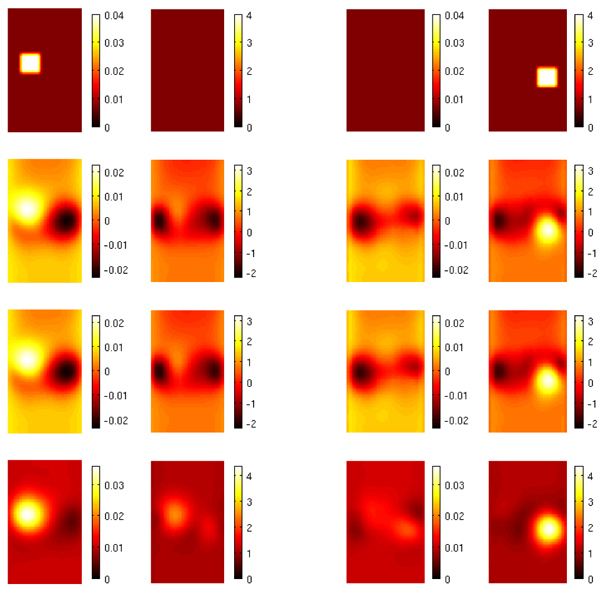
Fig. 5.

Vertical slices at the depths x = 21mm (two columns from the left) and x = 45mm (two columns from the right) from 3D reconstructions of absorption (left) and scattering (right) distributions with mismodelled background. The images from top to bottom are: target distribution (top row), and reconstructions using RM (second row), EM-1 (third row), and EM-2 (fourth row).
