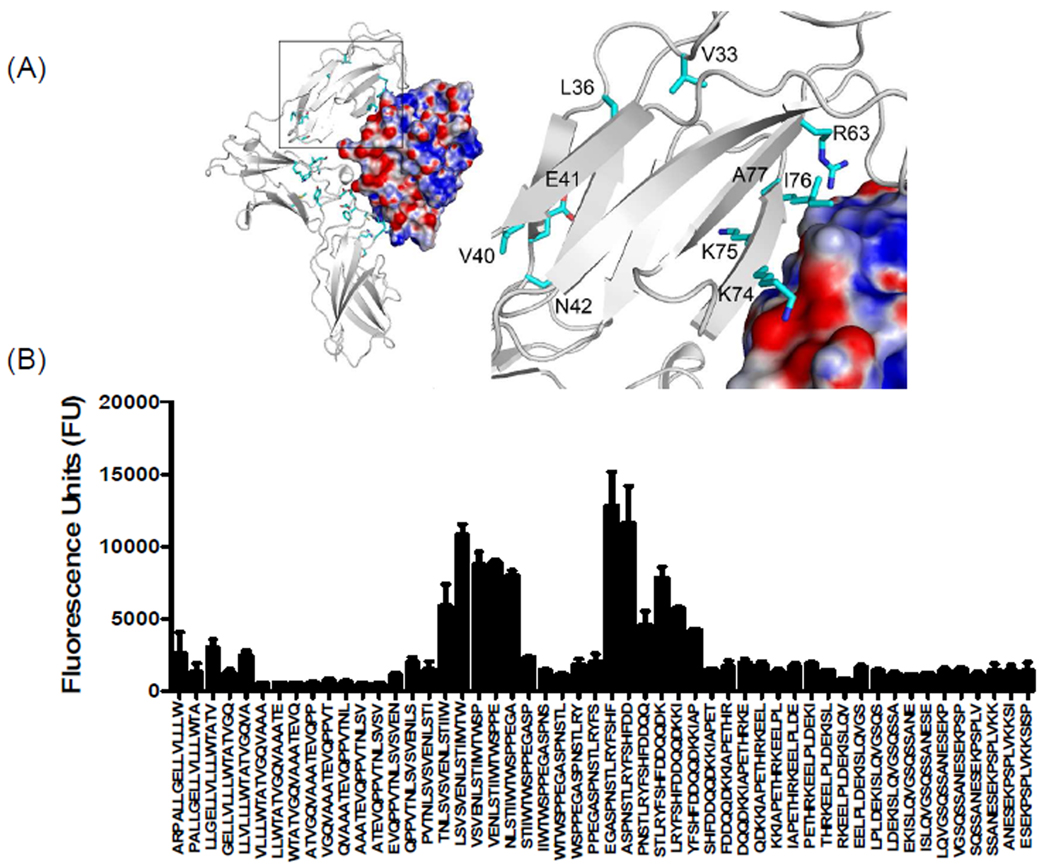
Figure 4. Characterization of binding interactions between mouse IL-13Rα1 domain D1 and IL-13 using peptide array analysis.
(A) Structure of the complex and enlarged view showing the interactions between domain D1 of mIL-13Rα1 (white) and IL-13. The electrostatic potential at the molecular surface of IL-13 is shown (blue, positive; red, negative; white, neutral) and residues identified using peptide arrays are highlighted on domain D1 of mouse IL-13Rα1. (B) The bar chart represents fluorescence reference units corresponding to overlapping peptide sequences from domain D1 of mIL-13Rα1.

