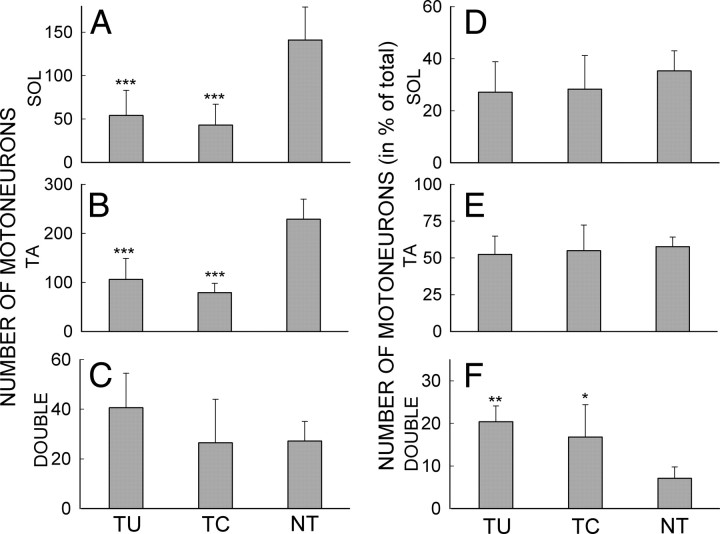
Figure 8.
A–C, Average (±SD) numbers of labeled SOL (A), TA (B), and double-labeled (C) motoneurons in TU, TC, and NT rats. D–F, Average (±SD) number of SOL (D), TA (E), and double-labeled (F) motoneurons in TU, TC, and NT rats (in percentage of total labeled motoneurons (i.e., sum of SOL, TA, and double-labeled motoneurons) in the rat group). TU and TC (i.e., the nerve-transected) rats have significantly fewer numbers of labeled SOL and TA motoneurons and higher proportions of double-labeled motoneurons than NT (i.e., the intact untransected) rats. ***p < 0.001; **p = 0.002; *p = 0.03 versus NT rats by ANOVA.

