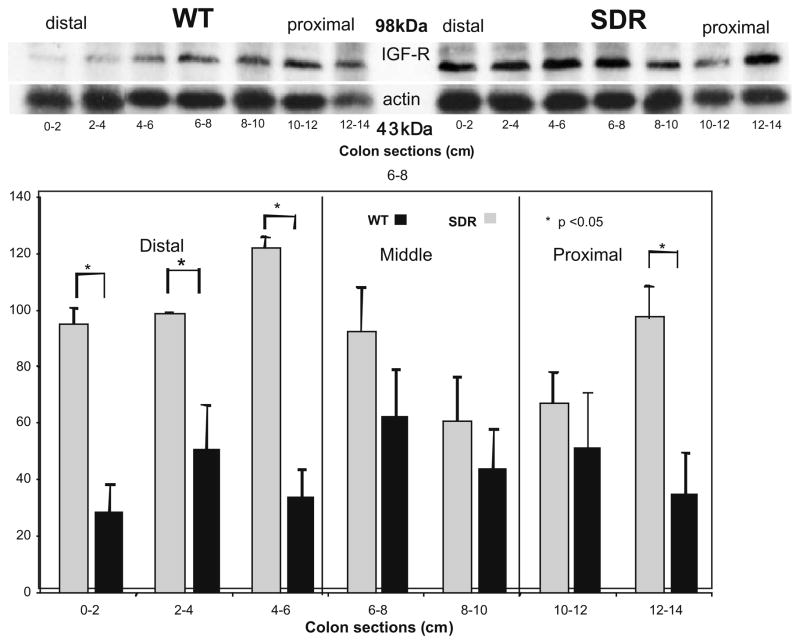
Fig. 6.
A representative Western blot for IGF-receptor and actin prepared from whole cell lysates of sequentially sectioned colons of control WT and SDR rats. Digital photographs of the relevant bands were obtained using an Eagle Eye imager, quantitated with Adobe Photoshop software, and normalized relative to actin intensity. Bar graphs calculated from 3 blots prepared from six control animals compare protein expression in distal, middle and proximal colon (mean ± SEM).

