Figure 2.
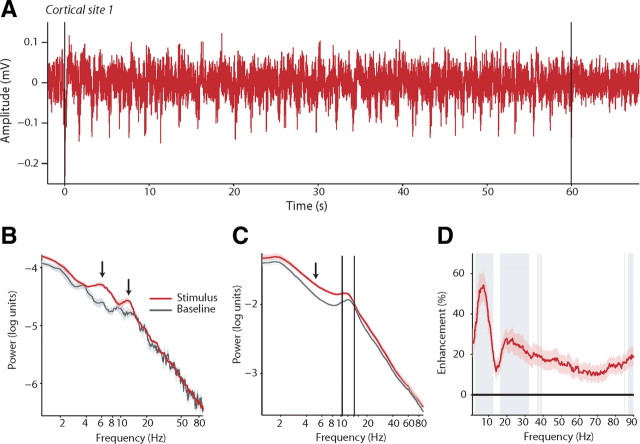
Single exemplars of LFP responses to natural savanna scenes. A, LFP response to a single savanna exemplar as a function of time for a single cortical site averaged over five repetitions. x-axes depict time in seconds; y-axes depict amplitude in millivolts. Black lines denote onset and offset of acoustic stimulation. B, Power spectrum of the LFP response shown in A during the presentation of the scene and during baseline. x-axes depict frequency in hertz; y-axes the power in logarithmic units. Error bars denote the SEM. C, Power spectrum of the LFP averaged over all cortical sites during the presentation of the savanna scenes and during baseline. Conventions as in B. Solid black lines are provided to guide the eye to a region of similarity between the stimulus-related LFP power spectrum and the baseline LFP power spectrum. D, Average enhancement of the power in the LFP over all cortical sites during the presentation of the savanna scenes relative to baseline. x-axes depicts frequency in hertz; y-axes depicts the enhancement in percentage. For additional details on the change in the LFP power for the riverine forest and rainforest acoustic scenes, see supplemental Figure S3 (available at www.jneurosci.org as supplemental material).

