
Figure 4.
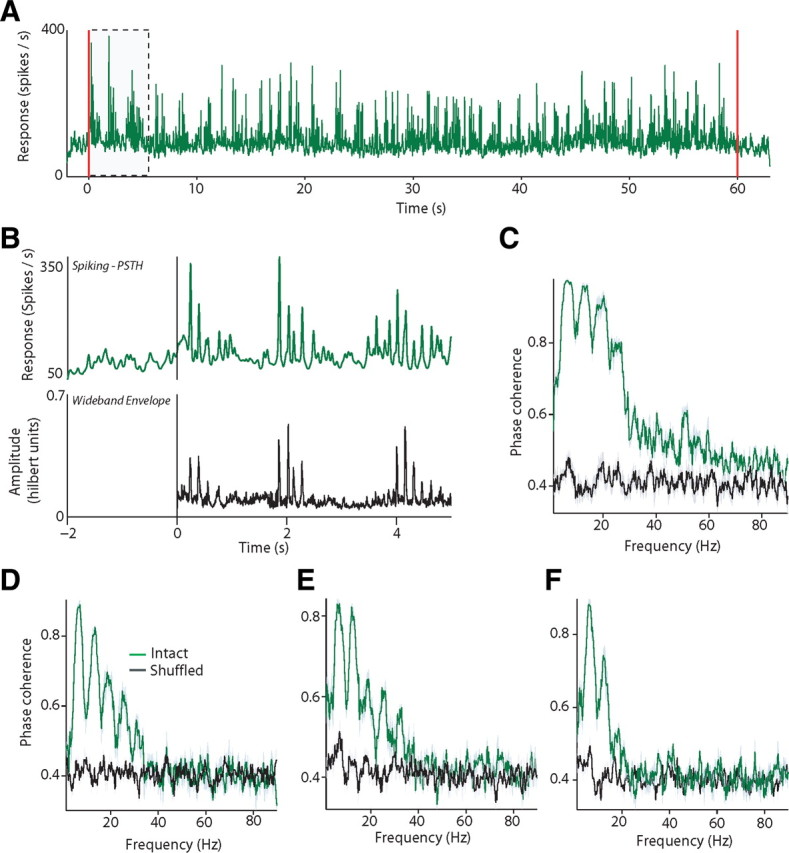
Single exemplars of spiking activity in response to natural savanna scenes. A, Peristimulus time histogram to a single savanna exemplar as a function of time for a single cortical site averaged over five repetitions. x-axes depicts time in seconds; y-axes depicts response in spikes per second. Red lines denote onset and offset of acoustic stimulation. B, Top, Expanded traces of the peristimulus time histogram (PSTH) between −2 and 5 s from the cortical site shown in A. x-axes depicts time in seconds; y-axes depicts amplitude in spikes per second. Bottom, Wideband envelope of the savanna acoustic scene during the same time period. x-axes depict time in seconds; y-axes depicts Hilbert transform amplitude. C, Phase coherence between the spiking activity and the savanna scene averaged over all intact pairs (red line) and shuffled pairs (black line) for the cortical site shown in A and B. x-axes depict frequency; y-axes depict phase coherence. Error bars denote SEM over either three intact or six shuffled pairs. D–F, Phase coherence between the spiking activity and the savanna scene averaged over all intact pairs (red line) and shuffled pairs (black line) for three other cortical sites. Figure conventions as in C.