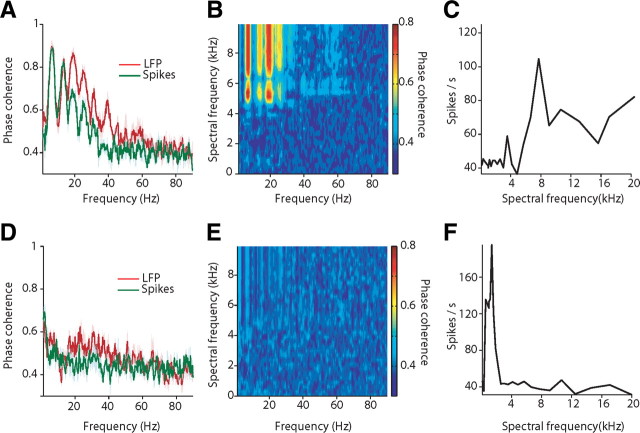
Figure 7.
Phase coherence between LFP, spiking activity, and natural scenes as a function of the spectral selectivity of the cortical site. A, Phase coherence between the wideband envelope of the natural scene and both LFP and spiking activity for a single cortical site. x-axes depict frequency in hertz; y-axes depict phase coherence. Note robust phase coherence between scene and neural activity for this site. B, Phase coherence between the LFP and narrowband envelopes of the natural scenes for the cortical site shown in A as a function of both spectral and temporal modulation frequencies. x-axes depict frequency in hertz; y-axes depict spectral frequency in kilohertz. Color bar denotes phase coherence. C, Spectral selectivity (tuning curve) for the cortical site for the cortical site shown in A and B. x-axes depict spectral frequency in kilohertz; y-axes depict response in spikes per second. D, Phase coherence between the wideband envelope of the natural scene and both LFP and spiking activity for another cortical site. Note the lack of locking to the savanna scene. E, Phase coherence between the LFP and narrowband envelopes of the natural scenes for the cortical site shown in D as a function of both spectral and temporal modulation frequencies. Conventions as in B. F, Spectral selectivity (tuning curve) for the cortical site shown in D and E. Conventions as in C. Note the selectivity of this site is in the frequency range of 1 kHz.

