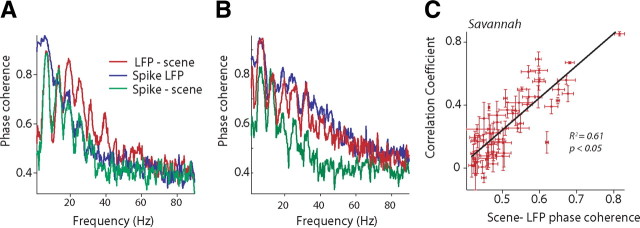
Figure 8.
Phase coherence between spiking activity and LFPs show strong relationships to temporal modulations in natural scenes. A, Phase coherence between the spikes and the savanna scene (green line), spikes and LFP (blue line), and LFP and savanna scene (red line) for a single cortical site. x-axes depict frequency in hertz; y-axes depict phase coherence. B, Phase coherence between spikes and LFP, spikes and scene, and LFP and scene for another cortical site. Figure conventions as in A. C, Left, Plot of correlation coefficient between savanna scene–LFP phase coherence and spike–field phase coherence for the population of cortical sites. Horizontal error bar denotes the SE for phase coherence over the three intact pairs. Vertical error bars denote the SE over correlations performed for the three intact pairs. x-axes depict savanna scene–LFP phase coherence; y-axes denotes the correlation coefficient. For similar results with riverine forest acoustic scenes, see supplemental Figure S7A (available at www.jneurosci.org as supplemental material).

