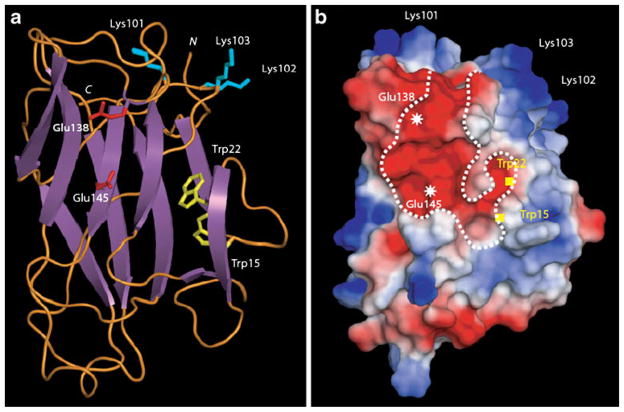
Fig. 1.
Molecular modeling of Nictaba sequence. a Ribbon diagram showing the β-sandwich organization of Nictaba. Exposed Lys residues participating to the nuclear localization signal are represented in sticks colored cyan. Glu residues occurring at the center of the putative chitin-binding groove are represented in sticks colored red. Trp residues possibly participating to the putative carbohydrate-binding pocket are represented in sticks colored yellow. N and C correspond to the N- and C-terminal ends of the polypeptide chain, respectively. b Mapping of electrostatic potentials on the molecular surface of the modeled Nictaba. The putative carbohydrate-binding groove is delineated by a dotted white line and the location of important residues is indicated. Electronegatively and electropositively charged areas are colored red and blue, respectively; neutral regions are shown in white

